

Understanding hit factor Scoring on PractiScore
Welcome to the world of practical action shooting! Understanding the scoring system can be overwhelming at first, but let’s break it down using a past APSC match result as an example. If you want to follow along, view these results here.
Understanding the Results
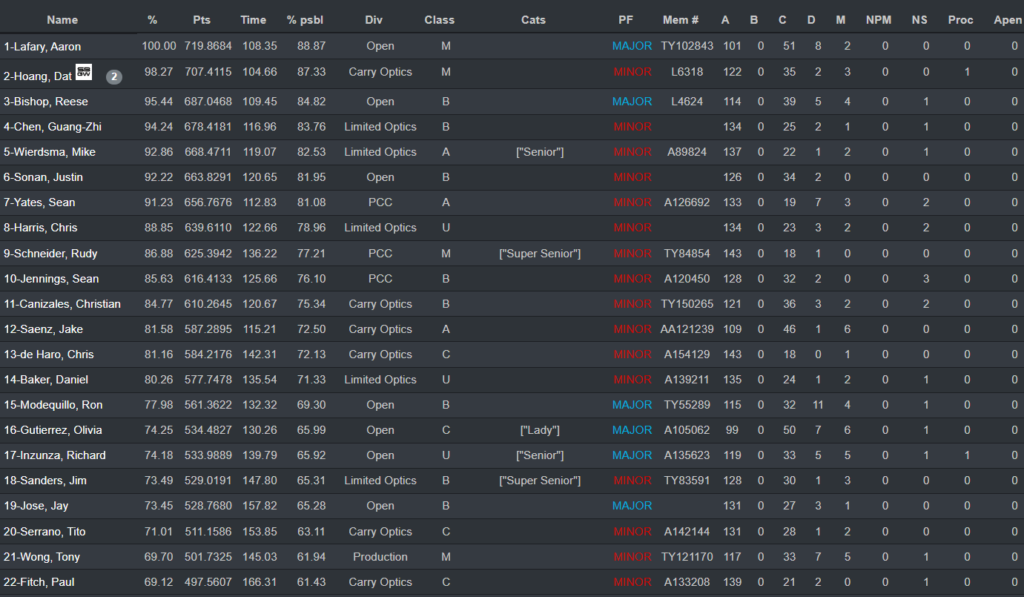
Rankings are initially presented as “Overall” which includes all divisions. While interesting, the rankings that truly matter are within each specific division. By filtering results to a specific division (like Production), you’ll see the standings as they apply to each division. Remember, divisions define different types of guns and gear, making it easier to understand how you did relative to other competitors shooting gear closer to yours. At the top of the page, you can change the “Overall” drop-down to match the division you are shooting in. You could use the two remaining drop downs to the right to compare yourself to other folks classified as you or shooting in the same category.

Deciphering Points and Hit Factors
Targets in hit factor matches, including USPSA and IPSC, are divided into Paper (scored based on hit zones) and Steel (scored as hit or miss). Paper targets have A-B-C-D scoring zones with points varying based on the Power Factor (Major or Minor).
| MAJOR POWER FACTOR | MINOR POWER FACTOR |
| A Zone = 5 Points | A Zone = 5 Points |
| C Zone = 4 Points | C Zone = 3 Points |
| D Zone = 2 Points | D Zone = 1 Point |
Steel targets are scored like an A Zone hit (5 points). Each stage has a total possible point score based on perfect performance. For example, if there were ten paper targets and two poppers, the maximum point value would be 110 points; the best two hits per paper, so 20 total scored hits on paper, plus ten more points for the two poppers. Points are calculated based on the hits in different zones and adjusted for Power Factor.
Your score per stage, known as Hit Factor, is calculated by dividing the total points scored by the shooter on a stage by the time taken to complete it, essentially measuring points per second. This method balances the importance of both speed and accuracy in the shooter’s performance.
So, if we look at the “Carry Optics” results for “Stage 1”, we can determine the following:

- Jake scored 73 points with a 10-point penalty, completing the stage in 8.95 seconds. His Hit Factor is calculated as (73 – 10) / 8.95 = 7.0391. He ranks first, earning the full 80 stage points, which is 100% of the possible score.
- Dat also scored 73 points with a 10-point penalty but took 9.45 seconds. His Hit Factor is (73 – 10) / 9.45 = 6.6667. He ranks second with 75.7676 stage points, which is 94.71% of the top score.
- Christian scored 74 points without penalty in 11.11 seconds, resulting in a Hit Factor of 74 / 11.11 = 6.6607. He is close behind in third place with 75.6995 stage points or 94.62% of the first-place score.
- Alonso scored 78 points with no penalty but took 12.86 seconds, leading to a Hit Factor of 78 / 12.86 = 6.0653. He is placed fourth, earning 68.9327 stage points, which is 86.17% of the top score.
Hopefully, this demonstrates how both speed and accuracy are crucial in achieving a high Hit Factor and ranking well in a stage.
Penalties and Time Factor
Penalties (for misses, no-shoots, etc.) are deducted from the actual points scored. A “Miss” results in a penalty of -10 points. As we calculated above, Hit Factor is calculated as points divided by the time taken, representing “Points Per Second”. While we want to avoid misses and other penalties like “No Shoots”, we also cannot let the clock waste away. It’s a balance of time and accuracy!
Stage and Match Scoring
Within a division, competitors are ranked by Hit Factor per stage. The top competitor gets 100% of the possible stage points, regardless of the actual points shot. Other competitors are awarded stage points as a percentage of the top shooter’s Hit Factor. Match points are the sum of stage points across all stages.
- Jake is the top scorer for this stage. His Hit Factor, after accounting for penalties and time, is the highest at 7.0391. Therefore, he is awarded the maximum stage points, set at 80 for this example. His stage percentage is 100%, indicating he has scored the highest possible points for this stage.
- Dat ranks second with a slightly lower Hit Factor of 6.6667. His stage points are calculated as a percentage of Jake’s top score. Since his Hit Factor is 94.71% of Jake’s, he receives 94.71% of the maximum 80 stage points, totaling 75.7676 points.
- Christian follows closely in third place. His Hit Factor is 6.6607, just a fraction less than Dat’s. Therefore, his stage points are also slightly less, at 75.6995 points, representing 94.62% of Jake’s score.
- Alonso, with a Hit Factor of 6.0653, earns stage points that are 86.17% of Jake’s score. This translates to 68.9327 stage points out of 80.
In summary, stage points are a way to rank each competitor against the stage’s top scorer. The top scorer gets 100% of the available stage points, and other competitors are awarded points based on their performance relative to the top scorer. This system rewards a balance of accuracy and speed and how well a competitor performs compared to others in the same stage. The overall match results consider all shooters, but division results are more relevant for awards and recognition.
This guide should help demystify the scoring process and enable you to interpret your Practiscore match results confidently!